Planning for success, presenting for success
How can manufacturing teams use 3D manufacturing simulation software to improve their communication?

Jargon, acronyms, spreadsheets and specifications; all of these are useful tools when talking to your peers. But, when you have to branch out and express ideas beyond your core group, they become a liability.
Being an expert in a specific area can sometimes make it difficult to find the rights words to communicate your ideas to outsiders. Because the manufacturing process includes so many disciplines – finance, engineering, operations, and others – it’s important for manufacturing engineers and production planners to be able to explain their work to a diverse audience.
To do this, a shared language must be used, and for many, showing is better than telling. The ability to collaboratively visualize and explore a manufacturing process makes it significantly easier to convey complex information to cross-functional teams. It also helps you make a much more compelling case.
In this article, we’ll review how manufacturing engineers and production planners can use 3D manufacturing simulation software to improve their communications.
Eliminating the Need for 1000 Words
When was the last time you saw data presented in a way that made it harder to understand? Maybe it was a spreadsheet presented in a PowerPoint presentation or a flow chart dropped into a Word document. Worse, it could have been a list of machine instructions displayed in raw code.
The issue is focusing on the effort, not the effect. Presenting data as visualization ensures that the focus of the discussion is on what the data means. It removes the need to dedicate time and energy explaining the data and instead focuses on what the data shows.
Presenting data as visualization ensures that the focus of the discussion is on what the data means.
An Example Process Plan
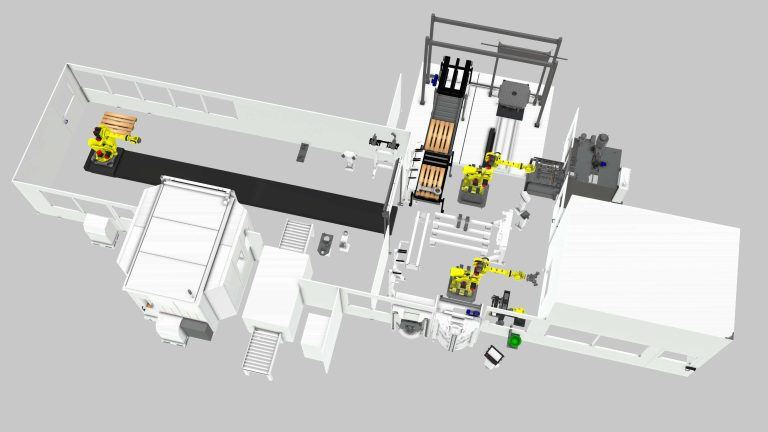
Data can be presented in a number of ways and using a multitude of tools, but the most effective strategies include intuitive explanations and visual representations. Pictures, spreadsheets, and charts are all examples of data visualizations that manufacturing engineers use to present information. And, while they help explain some information, they often leave out important details and context. Each of these visualizations is good at explaining certain information in the production process, but none can synthesize and illustrate all of the layers of data. 3D manufacturing simulation software is designed to illustrate all of the complex layers of data in a manufacturing process. It can be used to create engineering-grade visualizations of production processes in the context of the production environment.
Let’s take the example of a manufacturing engineer that’s responsible for designing a new production line. The line has 8 unique steps that can be laid out in order. To explain the production process to management, the engineer creates a Gantt chart:
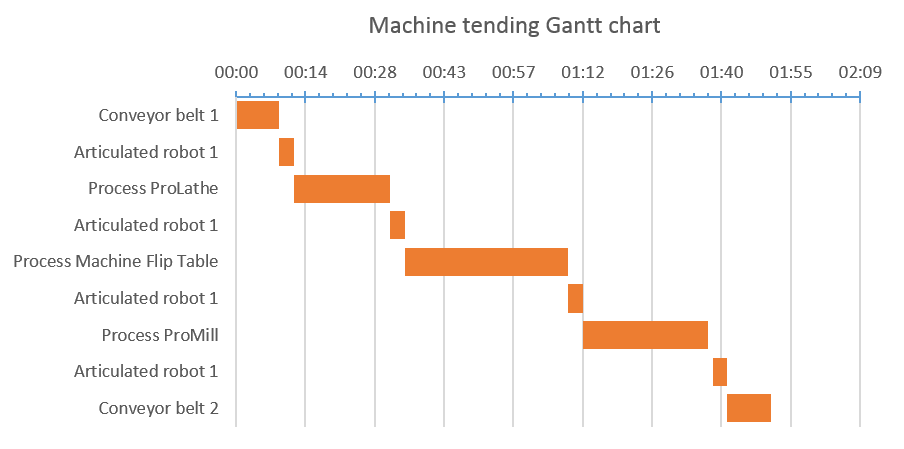
For the manufacturing engineer who designed the production line, and probably some of her colleagues who are familiar with the project, this illustration might explain everything.
However, when they have to communicate the process to management, they will spend valuable meeting time explaining how to interpret the chart and context.
- How is this process laid out on a plant floor?
- Is there a conveyor belt linking each process step?
- Which steps use labor?
- Are the times rigid or is this showing the average of a distribution?
- Does one gripper arm work in two places, or are there two machines?
- How do I share/change/update this chart and what effect does that have?
Presenting a visual simulation of this data would help stakeholders understand more quickly what’s happening, so the discussion can move to more productive areas and important issues.
Letting A Plan Speak For Itself
In any planning scenario there will be a time for presenting. As alluded to above this need to present a new plan is hindered by the reliance on tools that are less than complete. By incorporating all of the relevant information in a single form a visual simulation enables viewers to go deep into the process if necessary, or convey things at a high level depending on what is needed.
For a system integrator responding to a request for proposal, the most useful information may be the costs. Costs may be rolled up from a series of spreadsheets, a bill of materials, a price list, and time estimations.
To a technical reviewer of the proposal the most relevant information may be how much setup and programming time each new machine will require. Getting a jump on that programming, by using the exported CNC control data from the simulation helps reduce this time directly in addition to better estimating it.
And for the facilities installation team the layout and configuration of the proposal may be useful in identifying risks before accepting the bid. Again having the exported layout files in a .dxf or .dwg that is useable in architectural planning not only improves estimation but also reduces the overall time required in design.
In all of these cases the information is available. Obscuring it in the wrong format may make the difference between winning the job and losing out to a competitor. It could also mean the difference between completing the project on time, or being delayed by redesigns that doom the product by delaying launch.
The common ground, and common file types, of a visual simulation ensure that the plan can speak for itself. In doing so it allows experts in every department to contribute their knowledge and provides the context to let others understand them.
By incorporating all of the relevant information in a single form a visual simulation enables viewers to go deep into the process if necessary, or convey things at a high level depending on what is needed.
Summary
When presenting a manufacturing process, it’s important to take into consideration the diversity of the audience and their interests. The information has to be conveyed in a way that can be quickly understood by cross-functional teams, includes all relevant information and facilitates a collaborative and productive discussion. By visualizing the manufacturing process, biases caused by misinterpretations can be reduced and the conversation can be focused on the issues that matter.
Further reading
Boosting production line efficiency: a guide on improving production output
Production efficiency is the cornerstone of success in manufacturing. It measures the effectiveness of resource utilization in the manufacturing process, aiming to maximize output while minimizing costs and waste. The...
An introduction to virtual commissioning
Virtual commissioning is reshaping the manufacturing landscape by employing computer simulations for testing and optimizing production systems before they're physically built. This approach not only simplifies the setup process and...
Are manufacturers really ready for the digital era? (survey results)
Legacy equipment and outdated practices can seem like relics from another age, especially as the world zooms ahead with digital innovations. Yet, they're more prevalent in the manufacturing sector than...