Vaisala optimized and validated its new logistics center with Visual Components
Vaisala recently built a new logistics center at its Vantaa headquarters to support growing production needs. Using Visual Components’ 3D simulation platform, the automation team modeled the entire facility to test layouts, validate workflows, and assess capacity before construction. The simulation revealed bottlenecks early, improved operator allocation, and informed decisions on material flow and AGV usage.
De-risking a €10M logistics center project with data-backed simulation
Designing a logistics center on paper is one thing. Knowing it will work in the real world is another.
At Vaisala, a €10 million investment in a new logistics center at their Vantaa, Finland headquarters prompted the automation team to simulate the entire operation before construction began. Using Visual Components, they built a full 3D model of the facility to test, validate, and refine the design. That virtual model and it’s accompanying simulation directly informed the final build, shaping the layout, improving workflows with real data, and laying the groundwork for future automation.
It all started with a simple space challenge—and a plan to build upward.
Making room to grow
Vaisala is a global company known for its precision instruments and sensors used in weather forecasting, life sciences, and industrial measurement. In recent years, growing production demand at their headquarters in Vantaa, Finland, put pressure on available space.
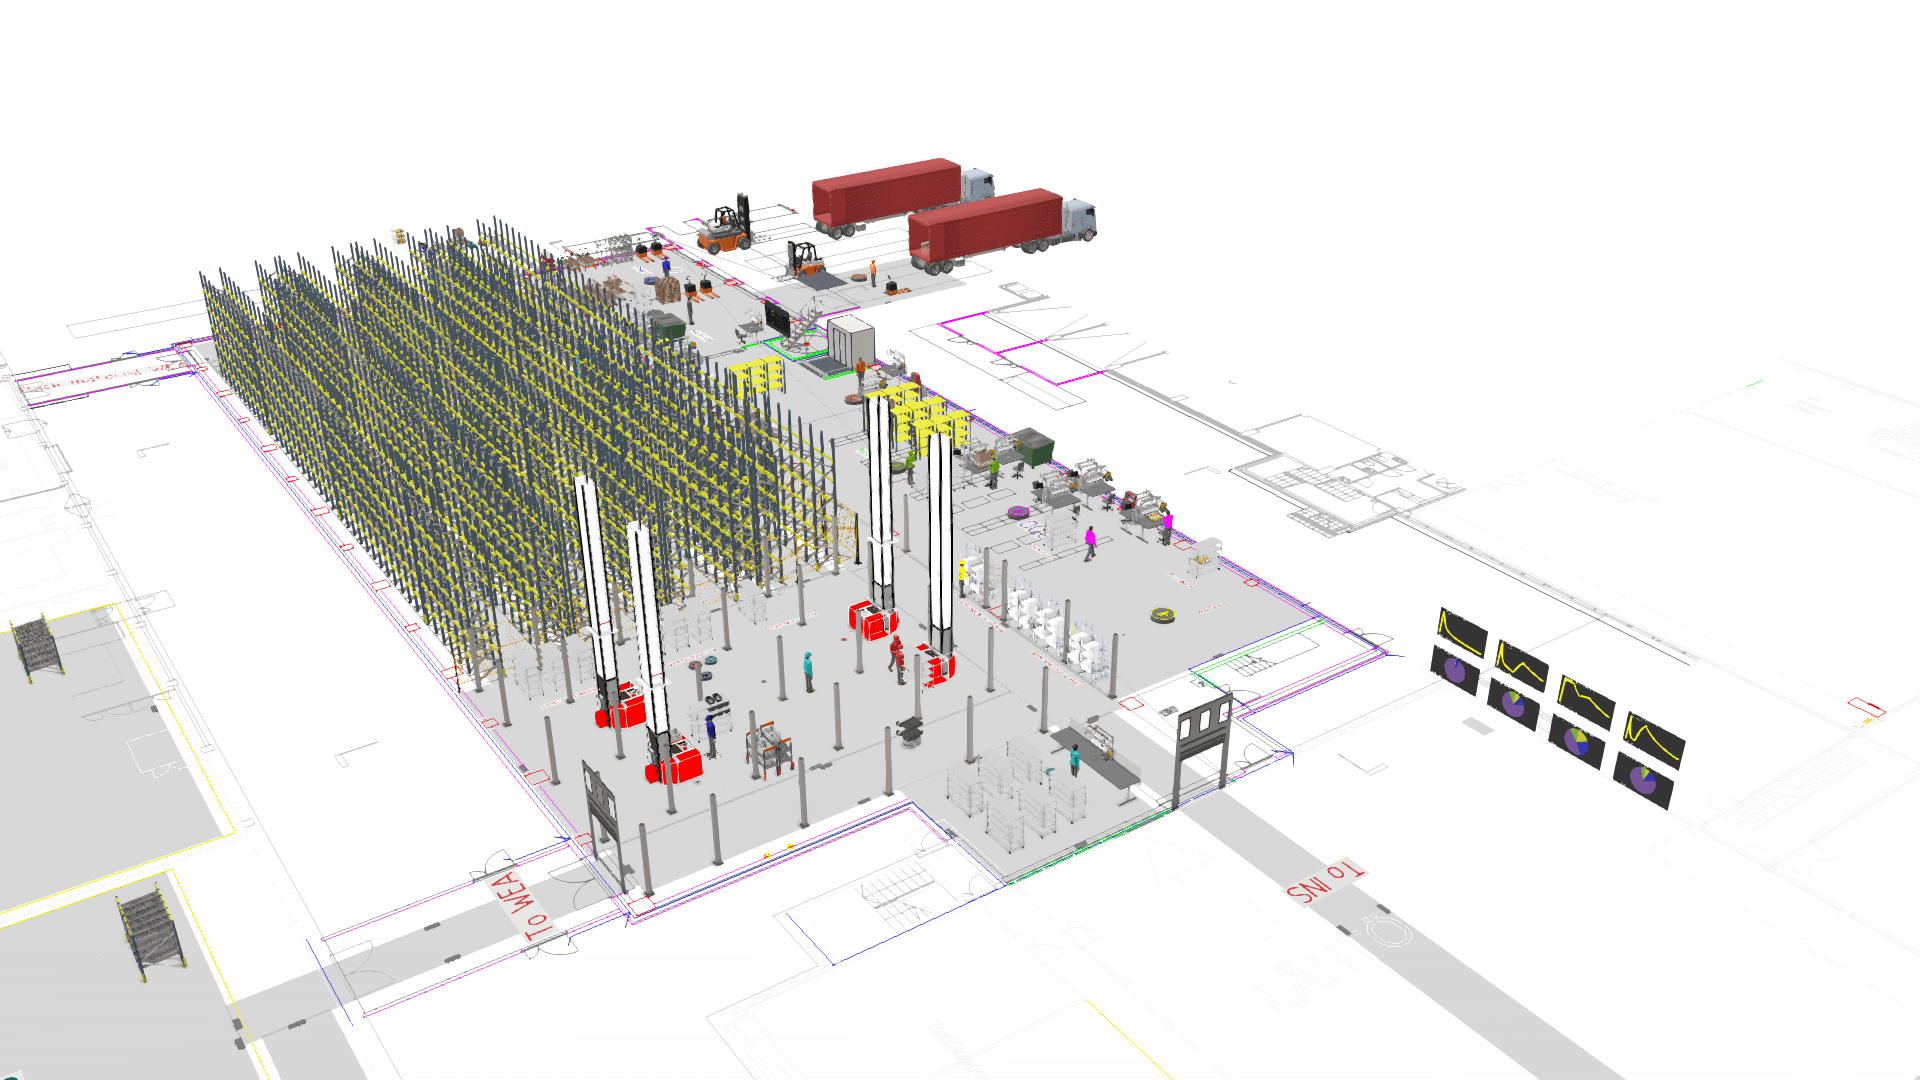
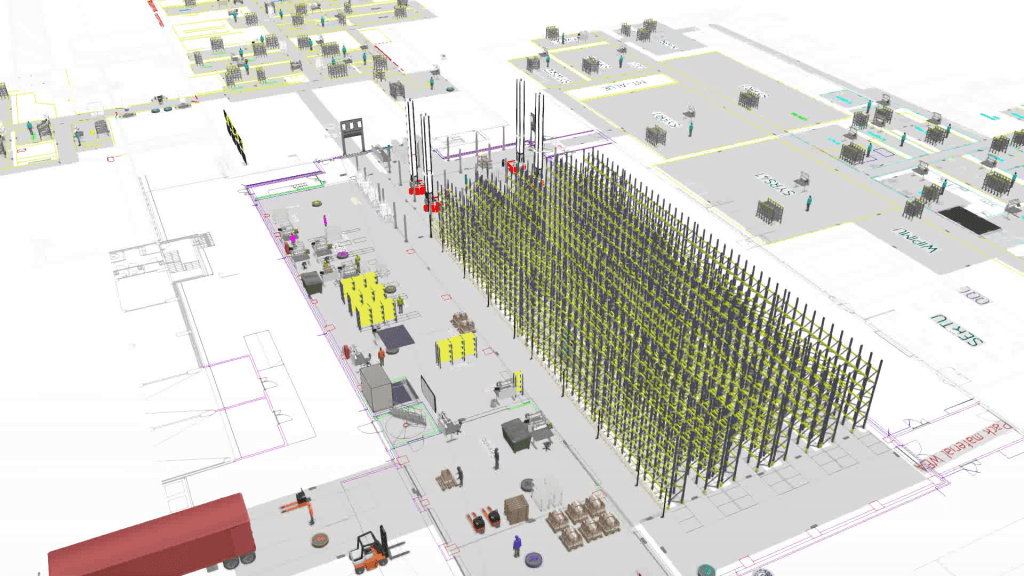
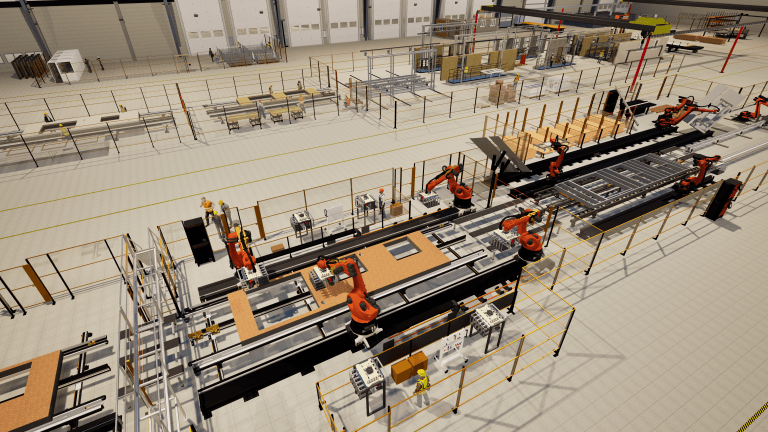
The solution? Build up. A 12-meter-high logistics center to free up the old warehouse for production. This move would double logistics capacity and open up valuable floor space. At the center of the new 2,000 square meter logistics center is the AutoStore system, a cube-based automated storage and retrieval system using 8,000 bins, 10 robots, and 6 ports. It was central to the overall layout and process design and formed the core which the rest of the logistics center was built around.
But with that many moving parts in a tight space, Vaisala’s team needed to be sure the system would work as intended. Would the mobile robots stay on schedule? Would the picking and repacking stations be overloaded? Would operators be able to move efficiently in the space? These questions couldn’t be easily answered in Excel or static CAD.
That’s when Senior Automation Engineer, Lorenzo Riggi, suggested building a simulation with Visual Components.
From concept to digital twin
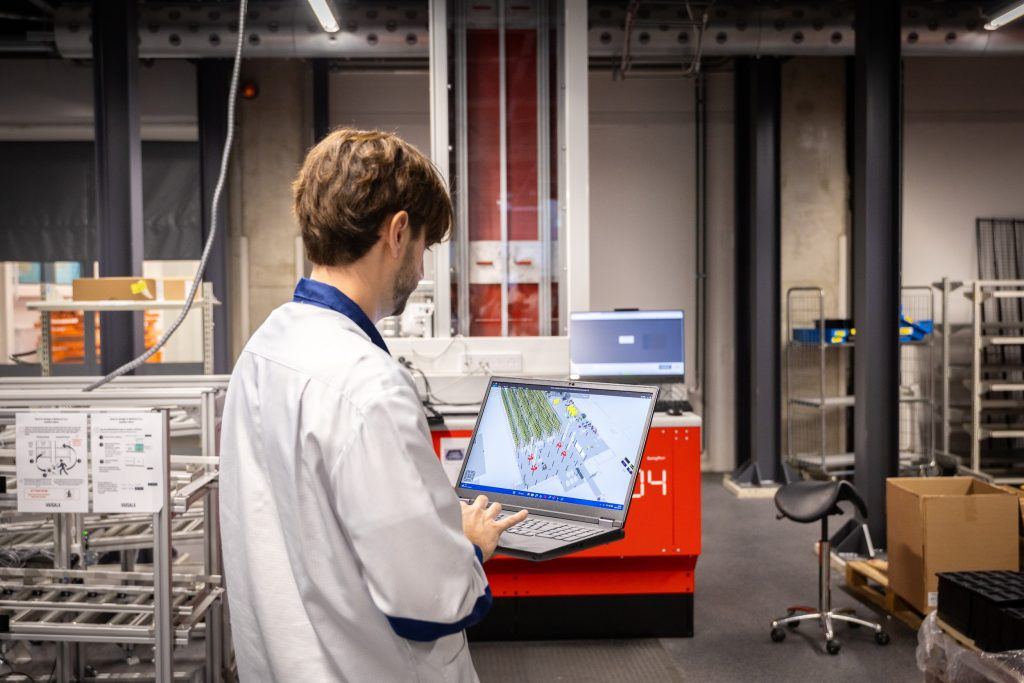
It all started with the idea of simulating mobile robots. And then it became, let’s simulate the entire logistics center. So, it became a bigger project than what I originally thought. I proposed that we would use it [Visual Components] to create a sort of ‘Digital Twin’ of the new logistics center that the company was building.
He decided then to model the entire facility in 3D. included all the planned equipment (picking carts, conveyors, AGVs, AutoStore ports) and connected it with real process data from their Enterprise Resource Planning (ERP) system.
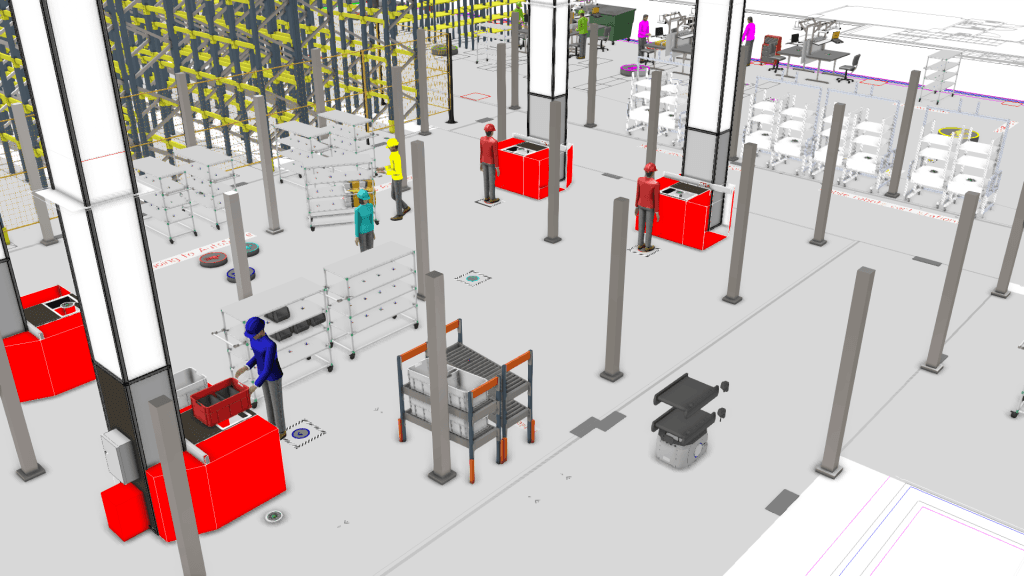
Every part of the logistics center was represented in Visual Components, from repacking stations to mobile robots. More importantly, the model was dynamic. As order flows changed or new design inputs came in, the model could simulate how the system would perform. Lorenzo and the team held regular meetings to review performance, adjust layouts, and test new ideas.
Anticipating and eliminating inefficiencies
The simulation surfaced several improvement opportunities early on.
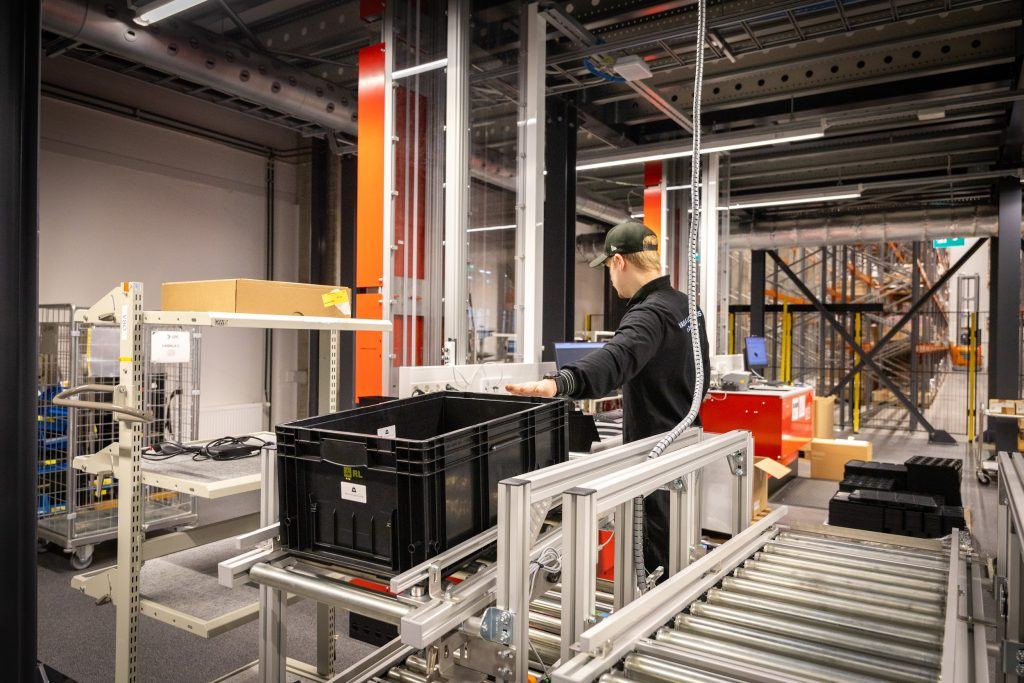
Repacking station utilization
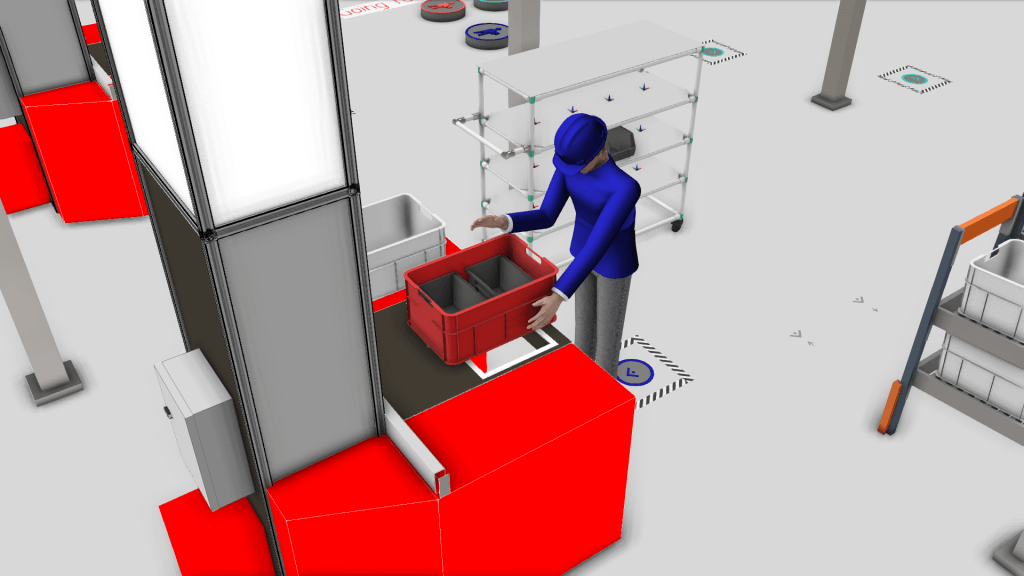
The first was at the repacking station. When the team ran a baseline simulation, the staff there showed a 98% utilization rate. “For example, assessing whether operator resources are optimally distributed across all processes,” says Riggi. “There’s no buffer for small delays or breaks.” The team responded by dividing the workload into two shifts. That reduced strain and improved long-term efficiency.
Understanding the picking cart bottleneck
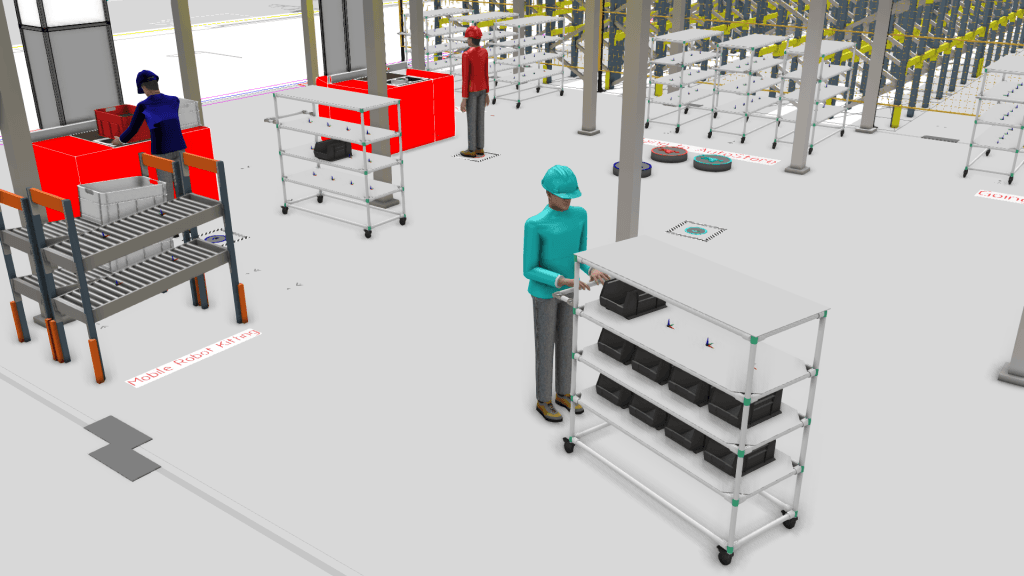
One of the most revealing findings came from analyzing the manual picking cart process. The default cart held 25 items, and filling it took about 44 minutes under current order conditions. The goal was also to understand whether carts were the right long-term solution at all.
The simulation helped highlight a significant opportunity:
- Manual carts deliver many items at once, but most of the time is spent filling them.
- With mobile robots carrying smaller batches (5–10 boxes depending on item size), replenishment becomes more frequent and more responsive.
This shift would create two major advantages for production:
- Operators complete assemblies faster because materials are replenished more often.
- Less duplicate material must be stored on the factory floor, reducing space needs and enabling more manufacturing cells.
Given how valuable floor space is at Vaisala, this insight became crucial for long-term planning.
AGV capacity and future scalability
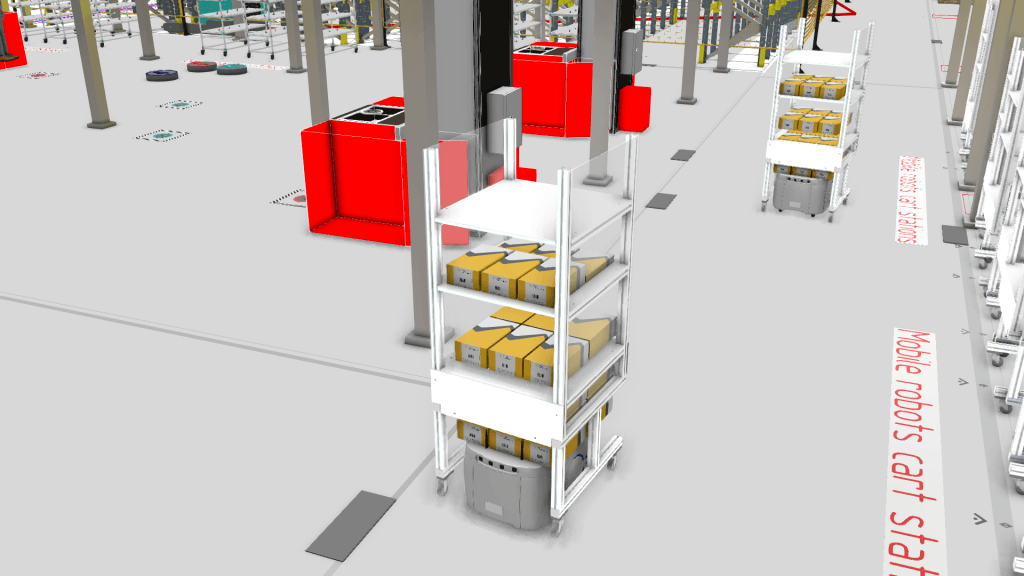
The simulation also evaluated mobile robot throughput. Today, with the current set up, the capacity is sufficient. However, the model showed that once new use cases are added (like automating more of the manual processes) in the future, the current fleet may approach its limits. But that early visibility helps the team plan ahead, long before capacity becomes a constraint.
Helping teams align faster
One of the biggest benefits of the simulation was communication. Instead of asking managers or non-technical stakeholders to read through complex reports, Lorenzo simply showed them the model. “Five minutes in the simulation replaced twenty minutes of explanations,” he says.
The simulation made it easier to secure approvals, test ideas, and bring new team members up to speed. Design changes that used to take days to review could now be visualized and discussed in a single meeting. It turned simulation into a shared language between engineering, operations, and management.
Building for now and next
The use of simulation doesn’t end once the logistics centre ramps up and is in full production. Because the model is flexible and connected to data from the ERP, the team can use it to test future changes.
Thinking of adding a conveyor segment to help eliminate a manual process? Simulate it. Wondering if different order mixes will slow things down? Run the numbers. The digital twin lets the team explore upgrades without disrupting operations.
Now I have my simulation of the logistics center and I have the data of every process. As new automation, equipment, or flow changes are proposed, they can be tested virtually before being implemented.
It’s also been used for operator training. “We can show new people how the system works before they set foot on the floor,” says Riggi. That visual training speeds up onboarding and helps with safety.
Going forward, the team plans to benchmark live performance against simulation data. By comparing what the system was supposed to do with how it’s actually performing, they can catch inefficiencies early and keep things running smoothly.
Changing how logistics is planned
Instead of waiting for problems to appear after installation, the team fixes them before anything is built. Instead of long reports, they present ideas in motion. And instead of debating guesses, they test scenarios with real data.
Lorenzo estimates the approach of planning the logistics center automation with Visual Components helped saved at least a month in planning time. It also prevented potential rework and helped the team make faster, smarter decisions.
My job is to implement new automation. And it’s just easier now. I already have the data. I already have the model. I can build the case, test it, and then show it. I have everything I need in Visual Components.
About Visual Components
Founded by a team of simulation experts and amassing over 25 years in business, Visual Components is one of the pioneers of the 3D manufacturing simulation industry. The organization is a trusted technology partner to a number of leading brands, offering machine builders, system integrators, and manufacturers a simple, quick, and cost-effective solution to design and simulate production processes and offline robot programming (OLP) technology for fast, accurate, and error-free programming of industrial robots.
Contact us today to explore how our solutions can help your business.
Further reading
MSK Finland advances robot cell automation and intralogistics planning with Visual Components offline programming and manufacturing simulation
MSK Finland increases efficiency in both robot cell automation and intralogistics planning using Visual Components robot offline programming (OLP) and manufacturing simulation software. By creating and validating robot programs virtually,...
Wiksfors uses Visual Components to bring renovation into the factory era with RenoChain
Modernizing Sweden’s aging housing stock calls for a smarter approach. With Visual Components, Wiksfors developed RenoChain, a factory-based renovation concept that uses simulation to plan and prove a faster, more...
Pivatic streamlines sheet metal machine sales, software validation, and line optimization with Visual Components
Designing complete sheet-metal fabrication lines is no small task. Each project brings together machines, motion, and control systems into one smooth, custom-built process. With Visual Components, Pivatic has been able...