Elevating assembly planning for elevator button panels at KONE with 3D simulation
Planning a new assembly line for two product variants, KONE’s Northern Italy site needed to ensure smooth flow and minimal risk of defects. With Visual Components, they simulated and tested different layout configurations, validated key decisions with statistical analysis, and clearly communicated the process before anything was built.
Elevating assembly planning for elevator button panels at KONE with 3D simulation
When KONE, a global leader in elevators and people-flow solutions, set out to design a new assembly line for elevator car operating panels (COPs) at its Northern Italy facility, the engineering team faced a complex challenge. The line needed to accommodate two distinct COP variants, minimize manual handling, and ensure a smooth, error-free assembly process. Leading the effort, Industrial Engineer Edoardo Mostacchi quickly saw that traditional planning tools weren’t enough. To design, test, and refine the line before anything was built, he turned to 3D simulation with Visual Components.
Challenges in designing the COP assembly line
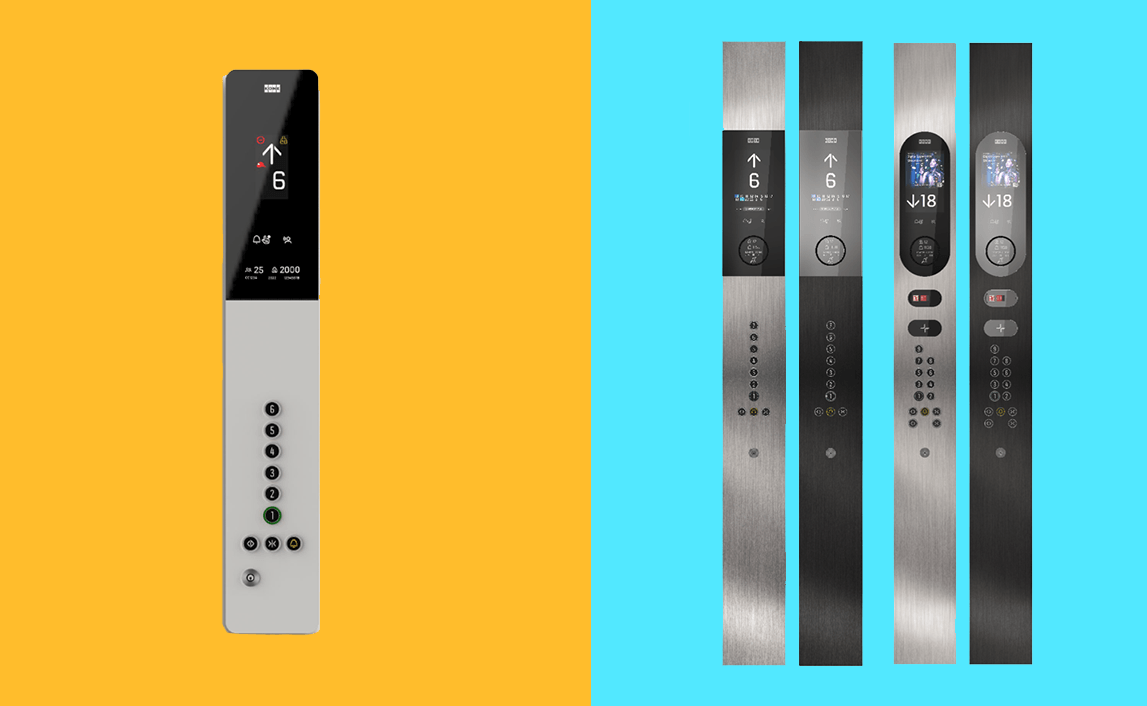
Designing an assembly line for elevator COPs came with several key challenges and requirements. First and foremost was product handling and quality. The COP faceplates, the interface panels in elevators with buttons and displays, had to remain intact. Any scratches or dents that might occur during assembly would be unacceptable, leading to rework, scrap, or quality issues. Reducing handling was a key consideration to help protect these sensitive parts.
Another challenge was managing two product variants on the same line. One COP variant was relatively simple, while the other was more complex with additional features. This meant different assembly times and potentially different workflows for each product type. The line needed to be balanced to handle both without causing bottlenecks or excessive idle time.
There were also space and layout constraints in the existing facility. Fitting a new conveyor system and multiple workstations into the available floor space required careful layout planning. The team had to ensure that operators could move safely and efficiently and that material could be delivered and removed without interfering with the workflow. Additionally, any new design had to integrate with upstream and downstream processes (like feeding components to the line and delivering finished panels to testing or packaging). These spatial and logistical constraints added complexity that is hard to capture with spreadsheets alone.
Communication was a softer but critical challenge. Explaining a complex new assembly process to stakeholders, from factory supervisors and operators to executives, can be difficult with 2D drawings or abstract charts. The team needed a clear way to demonstrate the planned process flow and benefits to get everyone on board.
These requirements set the stage for adopting a simulation-based design approach using Visual Components.
Simulation-driven design
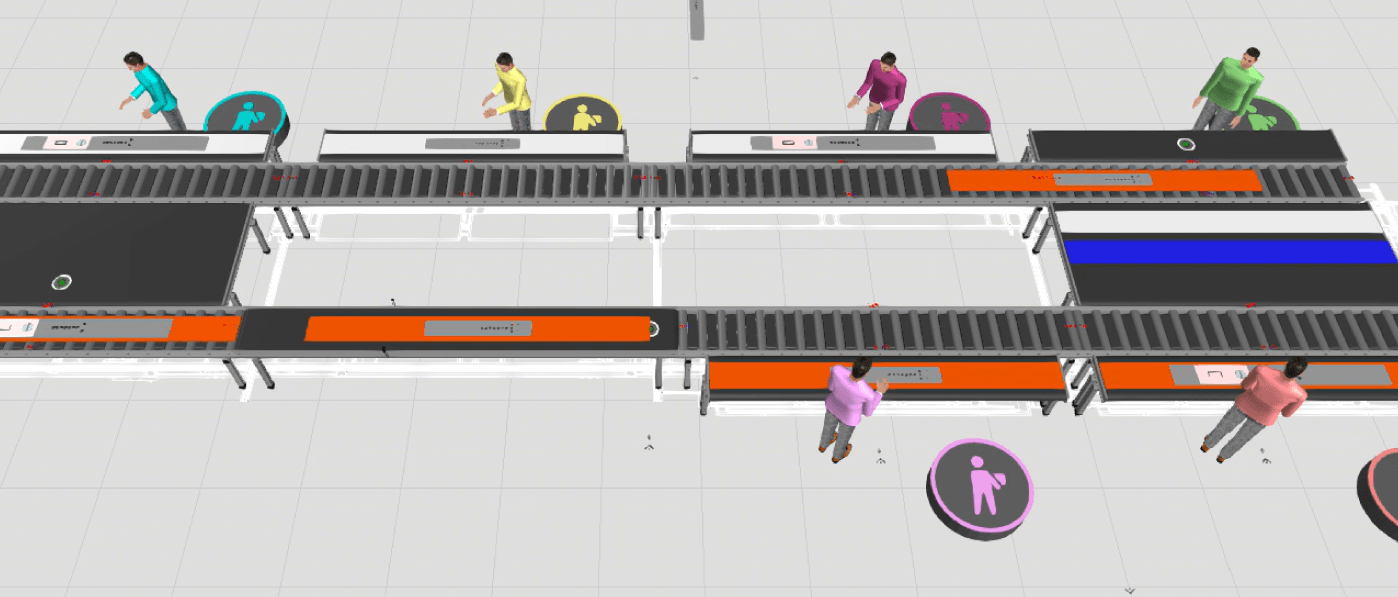
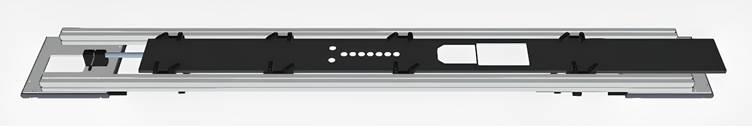
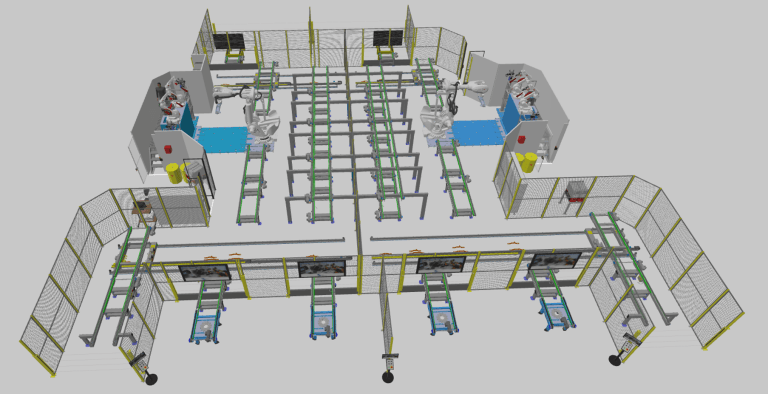
The core idea of the assembly line was to keep each COP faceplate secured on a dedicated pallet throughout the assembly process, virtually eliminating direct manual handling of the faceplate after its initial loading. The pallet fixtures would travel along a conveyor system from one station to another.
The conveyor technology chosen for this concept was a Bosch Rexroth TS2 modular assembly conveyor (available in Visual Components’ eCatalog) capable of transporting these pallets between stations.
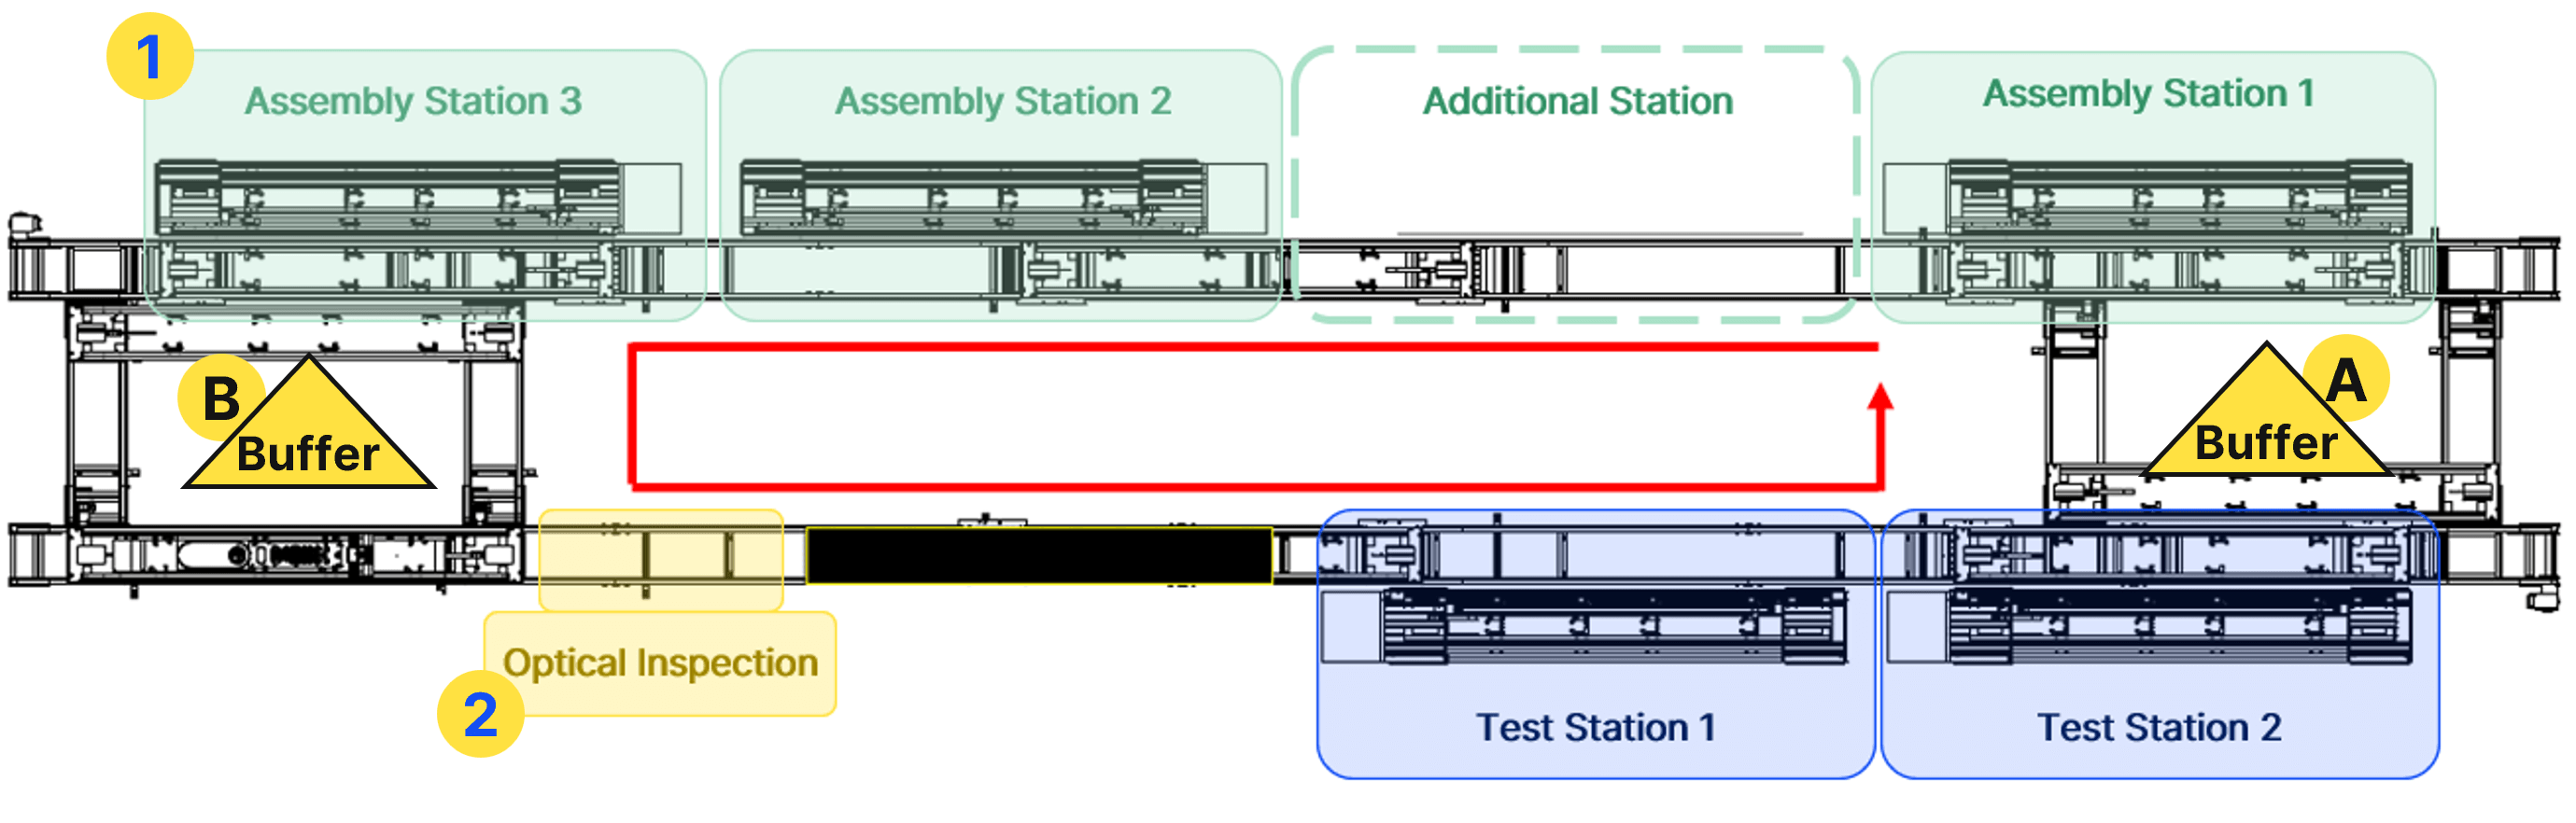
From a process perspective, starting from the area labelled “A,” there are three buffer spaces primarily dedicated to empty pallets, those not carrying any COP. Next, the circuit leads to three assembly stations, which operate autonomously and in parallel. Each station calls one pallet at a time to start and end the assembly of a specific COP. Once assembly is complete, the station unloads the pallet, now carrying the assembled COP, back into the circuit. These pallets then move toward a second buffer, located at position B, with a capacity of three. Each assembly station, after unloading a pallet, can immediately call a new one from buffer A. These buffers act as shock absorbers for the workflow, smoothing out variability and minor delays. The sizes of these buffers (how many pallets they can hold) were variables the team could adjust in simulation to see their effect on throughput and continuity.
Downstream of buffer B is an advanced Optical Inspection system, based on Artificial Intelligence and Optical Charter Recognition, which checks whether the visible components have been assembled correctly. If any assembly errors are detected, the pallet carrying the incorrectly assembled COP is automatically redirected to buffer A, bypassing the Test stations. This ensures that the defective COP returns to the Assembly stations, which are equipped with the necessary tools and components for reassembly.
If the COP passes the Optical Inspection, the pallet stops immediately after, where it awaits recall by one of the Test stations. These stations follow the same logic of recall and unloading as the Assembly stations. Once the pallet arrives at a Test station, the COP is tested to verify its proper functionality. After testing, the COP is manually removed from the pallet and transferred to a Packing station located outside the automated circuit. The Test operator then releases the empty pallet back into the circuit, where it moves to buffer A, ready to be called by an Assembly station, thus completing the loop.
“Without simulation, our initial planning was rough. We would do some calculations based on existing information on the manual tasks, but it didn’t give us any real insight into things like the number of pallets needed or how the flow would work. It (simulation) gave us visibility into the process that we just couldn’t get with calculations and Excel spreadsheets.”
Edoardo Mostacchi, Industrial Engineer, KONE
By simulating the inclusion of inspection and testing in the line, the team ensured the assembly process wasn’t optimized in isolation. It accounted for quality control, which can impact throughput if not properly buffered and balanced. All these elements (palletized transport, buffers, crossing conveyors, multiple stations, quality checks) were modeled in Visual Components. The simulation created a virtual assembly line that mirrored the proposed real-world layout and process logic. This allowed Edoardo and his team to walk through the entire process virtually. Any potential issue, like an accumulation of pallets at a station or an idle operator waiting with nothing to do, would show up in the simulation animation, making it immediately clear where the process needed improvement.
Simulation methodology and MTM analysis

To ensure the simulation was technically sound, the team employed a rigorous methodology, combining industrial engineering time analysis with the 3D modeling and statistical capabilities of Visual Components. A cornerstone of their approach was using MTM (Methods-Time Measurement) data as input for all manual tasks in the model. MTM is a predetermined time standards system where each minute motion or step in a task has an established time value. KONE’s engineers had MTM-based standard times (or similar time study data) for assembling the COPs, for example, the time to tighten a screw, connect a wire, or test a component. They incorporated these times into the simulation for each station’s work content. By doing this, each assembly station in the model had an accurate cycle time based on real measured data rather than guesses.
“We used simulation to test different scenarios—three or four stations, different pallet counts, varying product volumes—and measured everything from throughput to operator utilization. That gave us real data to base our decisions on.”
Edoardo Mostacchi, Industrial Engineer, KONE
The simulation was set up to run through a representative production period (for example, a full 8-hour shift or enough cycles to reach a steady state). During a simulation run, virtual sensors and counters tracked key metrics: how many COP units were assembled and passed testing, how long each pallet spent in each stage, how busy each operator was, etc. This data could be extracted from Visual Components for analysis. The team ran multiple simulation experiments, each representing a different proposed configuration or scenario for the assembly line. Between runs, they would adjust certain parameters or layouts to see how the performance changed.
Several configuration options were tested in simulation to identify the optimal design:
- The team explored whether to use three or four assembly stations, using simulation to assess if adding a fourth was necessary to meet production targets, or if minor optimizations within a three-station setup could achieve the same results.
- They also examined how many pallets should circulate through the system. Simulations helped identify the ideal number needed to maintain smooth flow and avoid bottlenecks.
- Buffer sizes and their placement were tested as well. The team used simulations to evaluate different configurations, aiming to maintain workflow continuity without causing unnecessary delays.
- To reflect real-world conditions, the simulation included a rework rate of 5%, based on historical defect data.
- Lastly, the team modeled the product mix, accounting for the expected volume share, for example, 30% simple COP and 70% complex COP.
Selecting the optimal configuration
“Simulation helped us figure out that 10 pallets in the loop was the sweet spot. With more than that, the system became congested. With fewer, some stations were starved. You can only find that balance by testing it virtually.”
Edoardo Mostacchi, Industrial Engineer, KONE
After thorough simulation and analysis, the engineering team arrived at a configuration that best met all the project goals.
The final assembly line design featured three manual assembly stations for the COPs, using the pallet-and-conveyor system with integrated quality checks as described. Through simulation, they determined that three well-balanced stations could handle both product variants effectively as long as the workflow was supported by the right number of pallets and buffer sizing.
The optimal number of pallets circulating in the system was found to be 10 pallets. At this level, the assembly stations were almost always occupied with work (keeping operators productive) but without causing excessive queueing of pallets at any point. Fewer than 10 pallets tended to leave some station idle at times (waiting for the next part), reducing throughput. More than 10 pallets showed diminishing returns as the pallets would simply start waiting in buffers with no improvement in completed units per hour, and would unnecessarily clutter the process. Thus, 10 was the sweet spot for maintaining a continuous flow. The team could confidently go forward with implementation, knowing that the layout and process had been vetted and validated in the digital world.
Results and looking ahead
In conclusion, KONE’s new COP assembly line in Italy was delivered successfully with the help of Visual Components’ simulation software. The project met its objectives of safeguarding product quality, meeting production targets, and improving stakeholder communication.
The heavy implication throughout this case is clear: by leveraging virtual assembly planning via simulation, the company was able to optimize its manufacturing process in a way that traditional methods simply could not match. The advantages ranged from tangible output gains and quality improvements to intangible benefits like team alignment and confidence in decision-making.
About Visual Components
Founded by a team of simulation experts and amassing over 25 years in business, Visual Components is one of the pioneers of the 3D manufacturing simulation industry. The organization is a trusted technology partner to a number of leading brands, offering machine builders, system integrators, and manufacturers a simple, quick, and cost-effective solution to design and simulate production processes and offline robot programming (OLP) technology for fast, accurate, and error-free programming of industrial robots.
Contact us today to explore how our solutions can help your business.
Further reading
MSK Finland advances robot cell automation and intralogistics planning with Visual Components offline programming and manufacturing simulation
MSK Finland increases efficiency in both robot cell automation and intralogistics planning using Visual Components robot offline programming (OLP) and manufacturing simulation software. By creating and validating robot programs virtually,...
Vaisala optimized and validated its new logistics center with Visual Components
Vaisala recently built a new logistics center at its Vantaa headquarters to support growing production needs. Using Visual Components’ 3D simulation platform, the automation team modeled the entire facility to...
Wiksfors uses Visual Components to bring renovation into the factory era with RenoChain
Modernizing Sweden’s aging housing stock calls for a smarter approach. With Visual Components, Wiksfors developed RenoChain, a factory-based renovation concept that uses simulation to plan and prove a faster, more...